Michel wrote: ↑Thu Jan 10, 2019 8:21 am
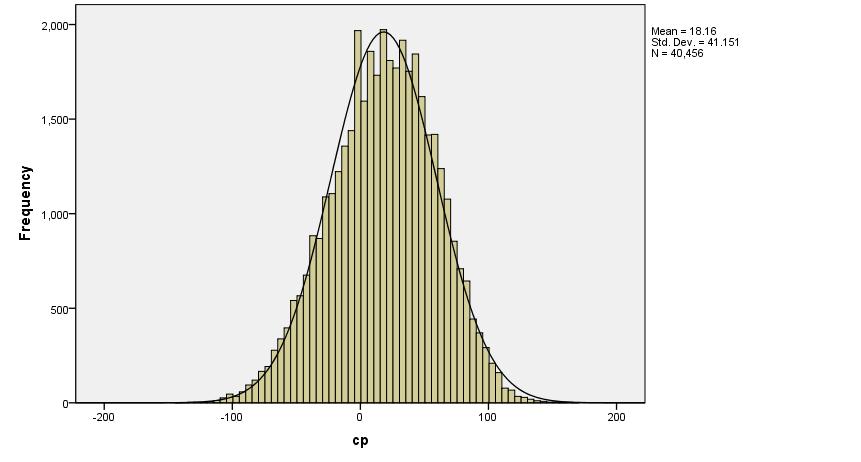
Thx! Great data as usual. It is nice that the normal distribution shows up. Very comforting.
Some care must be taken in interpreting this data.
- Nowadays SF uses of course contempt so that may inflate the bias when measured with real games (unknown in what way).
- The transformation bias->SF eval has its own variance (another unknown
 ) so the true bias distribution should be even narrower than your picture (the total variance is the sum of the variance of the bias and the variance of the measurement, assuming these are independent).
Isn't this a strong assumption?
Tomorrow I will do an independent calculation using the pgns I downloaded from fishtest (I am not sure though that there are enough games per position to get a meaningful result, maybe I have to download more).
If I understand, you will try to extract the Elo performance of all 40,000+ positions used? You will need many millions of games to get something reliable.
I selected 100 random positions from 2moves_v1.epd, and self-played 100 games each position at fast TC, to get Elo performance of each position. I got this:
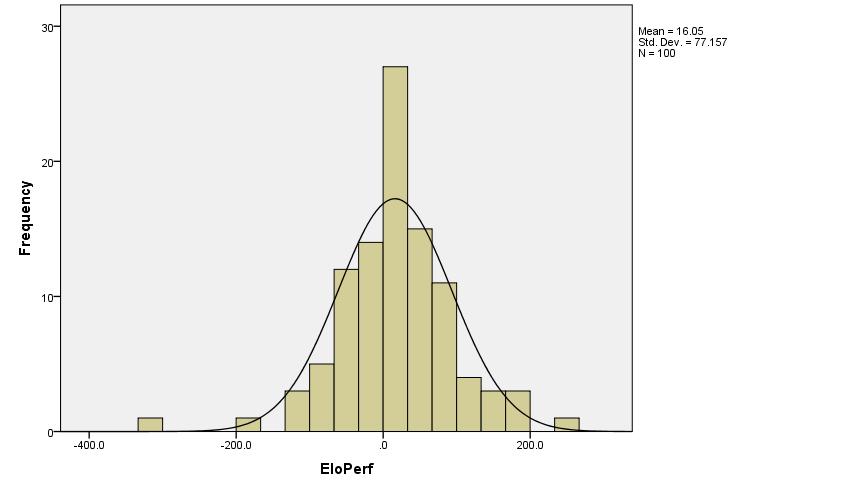
N = 100 positions
Mean Performance = 16.1 Elo points
Standard Deviation = 77.2 Elo points
But the problem is the shape is not very normal, the normal cannot accommodate both the center bulk and the tails, and one can say that the tails are too long. In these 100 positions, there were 2 hard outliers (not related to error margins), and 3-4 softer outliers.
The Std. Dev. is about 77 Elo points, and this variance comes from at least two sources: intrinsic variance of openings and variance in 100 games, which is given by about 30 Elo Points Std. Dev. So, "Intrinsic Standard Deviation" seems to be about 70 Elo points (instead of 77).
These are very rough and flimsy results, I hope you will come with something solid.