P-value is 0.00415, quite significant that the distribution is not normal.Laskos wrote: ↑Thu Jan 10, 2019 3:16 pmIsn't this a strong assumption?Michel wrote: ↑Thu Jan 10, 2019 8:21 am Thx! Great data as usual. It is nice that the normal distribution shows up. Very comforting.
Some care must be taken in interpreting this data.
- Nowadays SF uses of course contempt so that may inflate the bias when measured with real games (unknown in what way).
- The transformation bias->SF eval has its own variance (another unknown
) so the true bias distribution should be even narrower than your picture (the total variance is the sum of the variance of the bias and the variance of the measurement, assuming these are independent).
If I understand, you will try to extract the Elo performance of all 40,000+ positions used? You will need many millions of games to get something reliable.
Tomorrow I will do an independent calculation using the pgns I downloaded from fishtest (I am not sure though that there are enough games per position to get a meaningful result, maybe I have to download more).
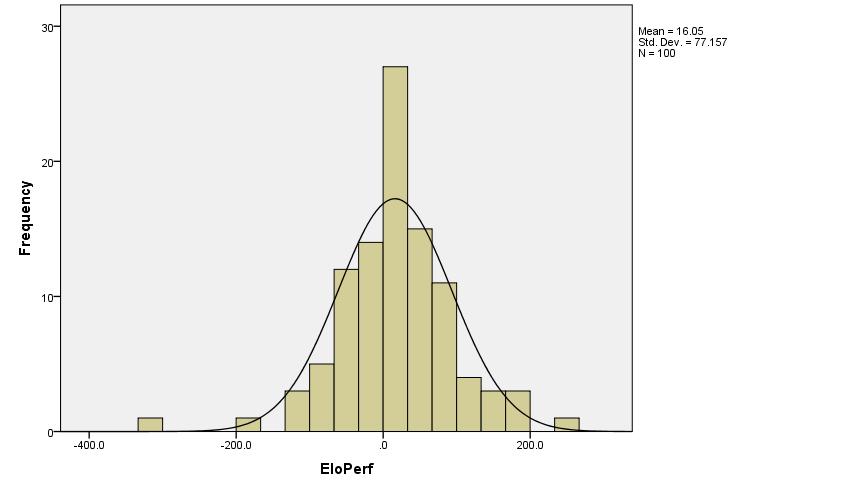
I selected 100 random positions from 2moves_v1.epd, and self-played 100 games each position at fast TC, to get Elo performance of each position. I got this:
N = 100 positions
Mean Performance = 16.1 Elo points
Standard Deviation = 77.2 Elo points
But the problem is the shape is not very normal, the normal cannot accommodate both the center bulk and the tails, and one can say that the tails are too long. In these 100 positions, there were 2 hard outliers (not related to error margins), and 3-4 softer outliers.
The Std. Dev. is about 77 Elo points, and this variance comes from at least two sources: intrinsic variance of openings and variance in 100 games, which is given by about 30 Elo Points Std. Dev. So, "Intrinsic Standard Deviation" seems to be about 70 Elo points (instead of 77).
These are very rough and flimsy results, I hope you will come with something solid.
Fixed nodes games and the pentanomial model.
Moderators: hgm, Rebel, chrisw
-
Laskos

- Posts: 10948
- Joined: Wed Jul 26, 2006 10:21 pm
- Full name: Kai Laskos
Re: Fixed nodes games and the pentanomial model.
-
Michel
- Posts: 2272
- Joined: Mon Sep 29, 2008 1:50 am
Re: Fixed nodes games and the pentanomial model.
Thx,Laskos wrote: ↑Thu Jan 10, 2019 4:31 pmP-value is 0.00415, quite significant that the distribution is not normal.Laskos wrote: ↑Thu Jan 10, 2019 3:16 pmIsn't this a strong assumption?Michel wrote: ↑Thu Jan 10, 2019 8:21 am Thx! Great data as usual. It is nice that the normal distribution shows up. Very comforting.
Some care must be taken in interpreting this data.
- Nowadays SF uses of course contempt so that may inflate the bias when measured with real games (unknown in what way).
- The transformation bias->SF eval has its own variance (another unknown
If I understand, you will try to extract the Elo performance of all 40,000+ positions used? You will need many millions of games to get something reliable.
Tomorrow I will do an independent calculation using the pgns I downloaded from fishtest (I am not sure though that there are enough games per position to get a meaningful result, maybe I have to download more).
I selected 100 random positions from 2moves_v1.epd, and self-played 100 games each position at fast TC, to get Elo performance of each position. I got this:
N = 100 positions
Mean Performance = 16.1 Elo points
Standard Deviation = 77.2 Elo points
But the problem is the shape is not very normal, the normal cannot accommodate both the center bulk and the tails, and one can say that the tails are too long. In these 100 positions, there were 2 hard outliers (not related to error margins), and 3-4 softer outliers.
The Std. Dev. is about 77 Elo points, and this variance comes from at least two sources: intrinsic variance of openings and variance in 100 games, which is given by about 30 Elo Points Std. Dev. So, "Intrinsic Standard Deviation" seems to be about 70 Elo points (instead of 77).
These are very rough and flimsy results, I hope you will come with something solid.
I had no time today but I did calculate the median predicted bias variance with the formula above (for the fishtest pgns) and I got 73 (logistic elo), which is in the same ballpark as your estimates above.
Ideas=science. Simplification=engineering.
Without ideas there is nothing to simplify.
Without ideas there is nothing to simplify.
-
Michel
- Posts: 2272
- Joined: Mon Sep 29, 2008 1:50 am
Re: Fixed nodes games and the pentanomial model.
Ok here are the results (not having much time I did it very quickly so I hope I did not make mistakes).
I took the pgns of about 150 tests on fishtest and grouped the results by opening (i.e. by starting fen). The raw data is here http://hardy.uhasselt.be/Toga/global.digest. There were some strange outliers so I removed the fens which have less than 20 games. The resulting histogram of the empirical bias is here

I processed the data and the results are as follows
So in this case the theoretical formula I gave above (which predicted a standard deviation for the bias of 73 elo) is very accurate!
So it seems to me that at least on this data set the correlation between the outcomes of games in a game pair is fully explainable by the elo model.
EDIT: I should point out that all the reported standard deviations were actually computed on the level of scores and then multiplied with the appropriate conversion factor (which is about 700). Since the transformation scores->elo is not linear for large elo differences, the standard deviation on the elo level may actually be a bit different from what is reported.
I took the pgns of about 150 tests on fishtest and grouped the results by opening (i.e. by starting fen). The raw data is here http://hardy.uhasselt.be/Toga/global.digest. There were some strange outliers so I removed the fens which have less than 20 games. The resulting histogram of the empirical bias is here
I processed the data and the results are as follows
Code: Select all
count(N>20)          =40457
avg. results/fen     =105.8
draw ratio           =0.67
average bias         =28.4
uncorrected std. dev.=74.3
internal std. dev.   =19.5
corrected std. dev.  =71.7
So it seems to me that at least on this data set the correlation between the outcomes of games in a game pair is fully explainable by the elo model.
EDIT: I should point out that all the reported standard deviations were actually computed on the level of scores and then multiplied with the appropriate conversion factor (which is about 700). Since the transformation scores->elo is not linear for large elo differences, the standard deviation on the elo level may actually be a bit different from what is reported.
Ideas=science. Simplification=engineering.
Without ideas there is nothing to simplify.
Without ideas there is nothing to simplify.
-
Laskos
- Posts: 10948
- Joined: Wed Jul 26, 2006 10:21 pm
- Full name: Kai Laskos
Re: Fixed nodes games and the pentanomial model.
Everything we did is consistent in the results. I am even surprised that my quick 70 Elo points result came so close to your robust results.Michel wrote: ↑Fri Jan 11, 2019 5:38 pm Ok here are the results (not having much time I did it very quickly so I hope I did not make mistakes).
I took the pgns of about 150 tests on fishtest and grouped the results by opening (i.e. by starting fen). The raw data is here http://hardy.uhasselt.be/Toga/global.digest. There were some strange outliers so I removed the fens which have less than 20 games. The resulting histogram of the empirical bias is here
I processed the data and the results are as followsSo in this case the theoretical formula I gave above (which predicted a standard deviation for the bias of 73 elo) is very accurate!Code: Select all
count(N>20)          =40457
avg. results/fen     =105.8
draw ratio           =0.67
average bias         =28.4
uncorrected std. dev.=74.3
internal std. dev.   =19.5
corrected std. dev.  =71.7
So it seems to me that at least on this data set the correlation between the outcomes of games in a game pair is fully explainable by the elo model.
EDIT: I should point out that all the reported standard deviations were actually computed on the level of scores and then multiplied with the appropriate conversion factor (which is about 700). Since the transformation scores->elo is not linear for large elo differences, the standard deviation on the elo level may actually be a bit different from what is reported.
A bit nitpicking, conversion to logistic should give 3-4 Elo points larger uncorrected SD. Also a bit larger internal ones, so for corrected 2-3 Elo points larger, almost exactly those 73 points fitted by the Elo model.
-
Michel
- Posts: 2272
- Joined: Mon Sep 29, 2008 1:50 am
Re: Fixed nodes games and the pentanomial model.
Yes everything seems to be consistent now.
It is interesting to compare the real game measurements with SF's eval (the Gauss curve you posted). It seems that 1cp of SFeval is worth about 1.6 elo. This is quite a bit higher than what I had expected. A small issue is that the ratio between SFeval and the measured elo bias does not quite match the corresponding ratio between the standard deviations (the ratios are 1.56 and 1.75 respectively). But as there is no reason to assume that the conversion elo->SFeval is truly linear, this (relatively small) difference does not appear worrisome to me (and there are of course other factors that may also influence the ratios somewhat such as the uncertainty in the measurements and the non-linearity of score->elo).
It is interesting to compare the real game measurements with SF's eval (the Gauss curve you posted). It seems that 1cp of SFeval is worth about 1.6 elo. This is quite a bit higher than what I had expected. A small issue is that the ratio between SFeval and the measured elo bias does not quite match the corresponding ratio between the standard deviations (the ratios are 1.56 and 1.75 respectively). But as there is no reason to assume that the conversion elo->SFeval is truly linear, this (relatively small) difference does not appear worrisome to me (and there are of course other factors that may also influence the ratios somewhat such as the uncertainty in the measurements and the non-linearity of score->elo).
Ideas=science. Simplification=engineering.
Without ideas there is nothing to simplify.
Without ideas there is nothing to simplify.
-
Laskos
- Posts: 10948
- Joined: Wed Jul 26, 2006 10:21 pm
- Full name: Kai Laskos
Re: Fixed nodes games and the pentanomial model.
However the SF eval and the performance are not matched even as statistical properties go, never mind case by case. Your performance graph shape (with that humongous database) will have longer tails if you applied the logistic and not just linear transformation. The center bulk would be the same, and the overall shape with its high peak and long tails surely is not normal one.Michel wrote: ↑Sat Jan 12, 2019 7:25 am Yes everything seems to be consistent now.
It is interesting to compare the real game measurements with SF's eval (the Gauss curve you posted). It seems that 1cp of SFeval is worth about 1.6 elo. This is quite a bit higher than what I had expected. A small issue is that the ratio between SFeval and the measured elo bias does not quite match the corresponding ratio between the standard deviations (the ratios are 1.56 and 1.75 respectively). But as there is no reason to assume that the conversion elo->SFeval is truly linear, this (relatively small) difference does not appear worrisome to me (and there are of course other factors that may also influence the ratios somewhat such as the uncertainty in the measurements and the non-linearity of score->elo).
With my small self-built database of 10,000 (100 x 100) games, I have the following shape of tentative Elo estimate for SF eval (an empiric logistic is applied):
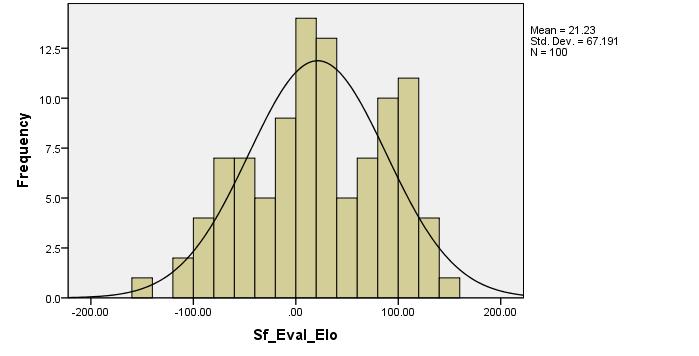
P-value is 0.35, so normal distribution is not ruled out. Some way or another, the SF eval of 2moves_v1 positions is quite close to normal distribution. While performances are ruled out to be normal even with my small dataset.
Also, on case by case, the correlation between empirical Elo of SF eval and the Elo performance is not that high, 0.52 (good that it is positive
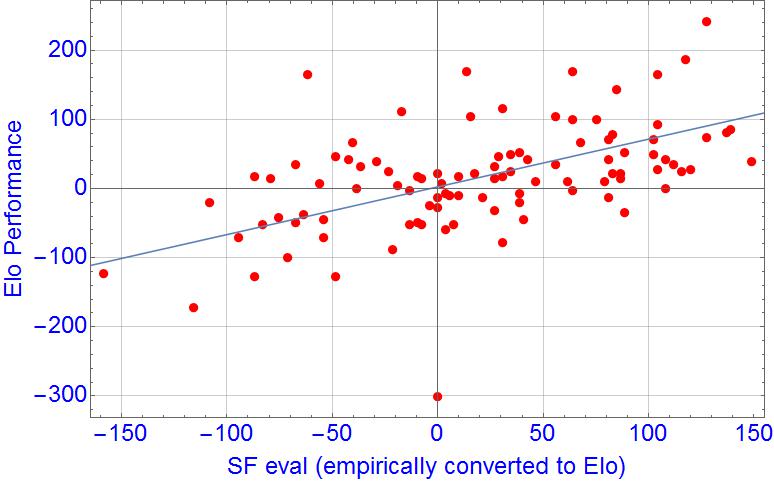
If the Elo model can explain all by the "bias", unreliability of SF eval is the reason I got correlations even with what SF considers "ultrabalanced positions".