Ok I decided to try to reproduce Kai's results for myself...
It turns out that correlation between games in a game pair is real and quite strong... and not only for fixed node games.
https://github.com/glinscott/fishtest/i ... -397088218
Fixed nodes games and the pentanomial model.
Moderators: hgm, Rebel, chrisw
-
Michel
- Posts: 2272
- Joined: Mon Sep 29, 2008 1:50 am
Re: Fixed nodes games and the pentanomial model.
Ideas=science. Simplification=engineering.
Without ideas there is nothing to simplify.
Without ideas there is nothing to simplify.
-
Michel
- Posts: 2272
- Joined: Mon Sep 29, 2008 1:50 am
Re: Fixed nodes games and the pentanomial model.
It is not important for the application indicated in the above issue, but for me the question remains: is the correlation due to varying(!) bias in the 2 moves opening book (i.e. explainable by the elo model), or is it due to the fact that the matches on fishtest are most of the time between very closely related engines that may potentially have a tendency to play similar games when confronted with the same opening position (i.e. not explainable by the elo model). Luckily I think this question should be answerable statistically to some extent (I need to think a little bit how).Michel wrote: ↑Tue Jan 08, 2019 11:00 pm Ok I decided to try to reproduce Kai's results for myself...
It turns out that correlation between games in a game pair is real and quite strong... and not only for fixed node games.
https://github.com/glinscott/fishtest/i ... -397088218
Ideas=science. Simplification=engineering.
Without ideas there is nothing to simplify.
Without ideas there is nothing to simplify.
-
Laskos

- Posts: 10948
- Joined: Wed Jul 26, 2006 10:21 pm
- Full name: Kai Laskos
Re: Fixed nodes games and the pentanomial model.
Very similar result with mine at fixed nodes. I had 3 million nodes per move (only 400 games), roughly equivalent to their LTC conditions at fixed time control. I got 17% compression in variance at fixed nodes, you got 15% compression at fixed time, within error margins, and consistent with all I got before (lower node or time count).Michel wrote: ↑Tue Jan 08, 2019 11:00 pm Ok I decided to try to reproduce Kai's results for myself...
It turns out that correlation between games in a game pair is real and quite strong... and not only for fixed node games.
https://github.com/glinscott/fishtest/i ... -397088218
-
Laskos
- Posts: 10948
- Joined: Wed Jul 26, 2006 10:21 pm
- Full name: Kai Laskos
Re: Fixed nodes games and the pentanomial model.
I had the same issue. At 300,000 nodes per move from 2moves_v1, I got 12% decrease in variance. From an ultrabalanced section of 2moves_v1, I got 9% decrease in variance. But they were considered "ultrabalanced" by the same Stockfish analysis. It's not a very faithful indicator of their real "bias". So, I had the same question.Michel wrote: ↑Wed Jan 09, 2019 7:37 amIt is not important for the application indicated in the above issue, but for me the question remains: is the correlation due to varying(!) bias in the 2 moves opening book (i.e. explainable by the elo model), or is it due to the fact that the matches on fishtest are most of the time between very closely related engines that may potentially have a tendency to play similar games when confronted with the same opening position (i.e. not explainable by the elo model). Luckily I think this question should be answerable statistically to some extent (I need to think a little bit how).Michel wrote: ↑Tue Jan 08, 2019 11:00 pm Ok I decided to try to reproduce Kai's results for myself...
It turns out that correlation between games in a game pair is real and quite strong... and not only for fixed node games.
https://github.com/glinscott/fishtest/i ... -397088218
Maybe that is interesting:
When Stockfishes are identical, fixed nodes 300,000 nodes are correlated 100% (variance is 0% of trinomial one). Although node resolution in SF is about 1000 or so. When 2 successive Stockfishes are playing (having a functional difference), the variance again decreases by the same 12%, the same as between two distant Stockfishes (say SF10 and SF_dev).
-
Michel
- Posts: 2272
- Joined: Mon Sep 29, 2008 1:50 am
Re: Fixed nodes games and the pentanomial model.
Thanks! I think this is all very interesting!
I still need to do the calculation but except for the exotic case of SF playing against itself with fixed nodes, maybe the elo model can explain things after all...
The pentanomial model has 4 degrees of freedom. If we use the BayesElo model then we now seem to have the following parameters for a combination of engines and opening book.
(the first two belong mostly to the engines, the last two should belong mostly to the book). So in principle we should be able to explain any set of 4 pentanomial parameters by the above 4 engine/book parameters. If the expectation/variance of the bias computed in this way seem reasonable for the book then that would be evidence that this line of thinking may be correct. Tonight I'll try to check it.
I still need to do the calculation but except for the exotic case of SF playing against itself with fixed nodes, maybe the elo model can explain things after all...
The pentanomial model has 4 degrees of freedom. If we use the BayesElo model then we now seem to have the following parameters for a combination of engines and opening book.
Code: Select all
elo, draw_elo, expected bias, variance of the bias.
Ideas=science. Simplification=engineering.
Without ideas there is nothing to simplify.
Without ideas there is nothing to simplify.
-
Michel
- Posts: 2272
- Joined: Mon Sep 29, 2008 1:50 am
Re: Fixed nodes games and the pentanomial model.
If the correlation has to be explained via the standard deviation of the bias then a rough estimate for this standard deviation (assuming it is not too large, and the elo differences are small) expressed in logistic elo appears to beMichel wrote: ↑Wed Jan 09, 2019 12:04 pm Thanks! I think this is all very interesting!
I still need to do the calculation but except for the exotic case of SF playing against itself with fixed nodes, maybe the elo model can explain things after all...
The pentanomial model has 4 degrees of freedom. If we use the BayesElo model then we now seem to have the following parameters for a combination of engines and opening book.(the first two belong mostly to the engines, the last two should belong mostly to the book). So in principle we should be able to explain any set of 4 pentanomial parameters by the above 4 engine/book parameters. If the expectation/variance of the bias computed in this way seem reasonable for the book then that would be evidence that this line of thinking may be correct. Tonight I'll try to check it.Code: Select all
elo, draw_elo, expected bias, variance of the bias.
Code: Select all
350*sqrt(-rho*(1-d))
Applied with rho=-0.15, d=0.64 we get 81 elo for the standard deviation of the bias of the 2 moves book. This seems rather high (I thought 100 elo is about 1 pawn). But as I said all the estimates are quite rough (including rho=-0.15) so perhaps a more accurate calculation would bring things down a bit.
I put the script to calculate the statistical information on Github. It works only with pgns which contain a setup tag.
https://github.com/vdbergh/compute_stats/
Ideas=science. Simplification=engineering.
Without ideas there is nothing to simplify.
Without ideas there is nothing to simplify.
-
Laskos
- Posts: 10948
- Joined: Wed Jul 26, 2006 10:21 pm
- Full name: Kai Laskos
Re: Fixed nodes games and the pentanomial model.
Here is the histogram of 2moves_v1.epd file analyzed by Stockfish (no Contempt) on 1 thread for 1s/position:
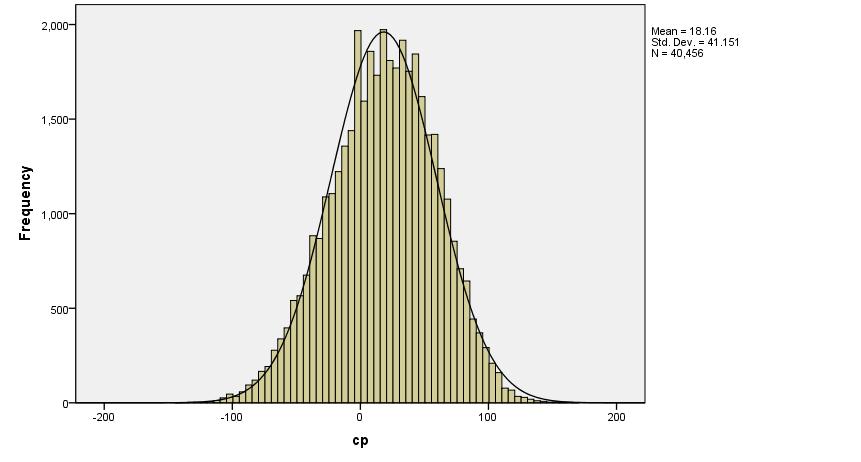
The black curve is the best fit for normal distribution with:
Number of positions: 40,456
Mean: 18.16 cp
Standard Deviation: 41.15 cp
The distribution obeys well the normal distribution (it has only a small skewness).
81 Elo points for the standard deviation seems indeed a bit high, but not by much, 50-60 might be close.
-
Michel
- Posts: 2272
- Joined: Mon Sep 29, 2008 1:50 am
Re: Fixed nodes games and the pentanomial model.
Thx! Great data as usual. It is nice that the normal distribution shows up. Very comforting.
Some care must be taken in interpreting this data.
Some care must be taken in interpreting this data.
- Nowadays SF uses of course contempt so that may inflate the bias when measured with real games (unknown in what way).
- The transformation bias->SF eval has its own variance (another unknown
 ) so the true bias distribution should be even narrower than your picture (the total variance is the sum of the variance of the bias and the variance of the measurement, assuming these are independent).
Ideas=science. Simplification=engineering.
Without ideas there is nothing to simplify.
Without ideas there is nothing to simplify.
-
Laskos
- Posts: 10948
- Joined: Wed Jul 26, 2006 10:21 pm
- Full name: Kai Laskos
Re: Fixed nodes games and the pentanomial model.
I measured the value of that 41.15 cp Std. Dev. in 4,000 self-games of Stockfish at 10s + 0.1s as 53 +/- 7 Elo points.Laskos wrote: ↑Wed Jan 09, 2019 11:41 pm Here is the histogram of 2moves_v1.epd file analyzed by Stockfish (no Contempt) on 1 thread for 1s/position:
The black curve is the best fit for normal distribution with:
Number of positions: 40,456
Mean: 18.16 cp
Standard Deviation: 41.15 cp
The distribution obeys well the normal distribution (it has only a small skewness).
81 Elo points for the standard deviation seems indeed a bit high, but not by much, 50-60 might be close.
-
Laskos
- Posts: 10948
- Joined: Wed Jul 26, 2006 10:21 pm
- Full name: Kai Laskos
Re: Fixed nodes games and the pentanomial model.
Isn't this a strong assumption?Michel wrote: ↑Thu Jan 10, 2019 8:21 am Thx! Great data as usual. It is nice that the normal distribution shows up. Very comforting.
Some care must be taken in interpreting this data.
- Nowadays SF uses of course contempt so that may inflate the bias when measured with real games (unknown in what way).
- The transformation bias->SF eval has its own variance (another unknown
If I understand, you will try to extract the Elo performance of all 40,000+ positions used? You will need many millions of games to get something reliable.
Tomorrow I will do an independent calculation using the pgns I downloaded from fishtest (I am not sure though that there are enough games per position to get a meaningful result, maybe I have to download more).
I selected 100 random positions from 2moves_v1.epd, and self-played 100 games each position at fast TC, to get Elo performance of each position. I got this:
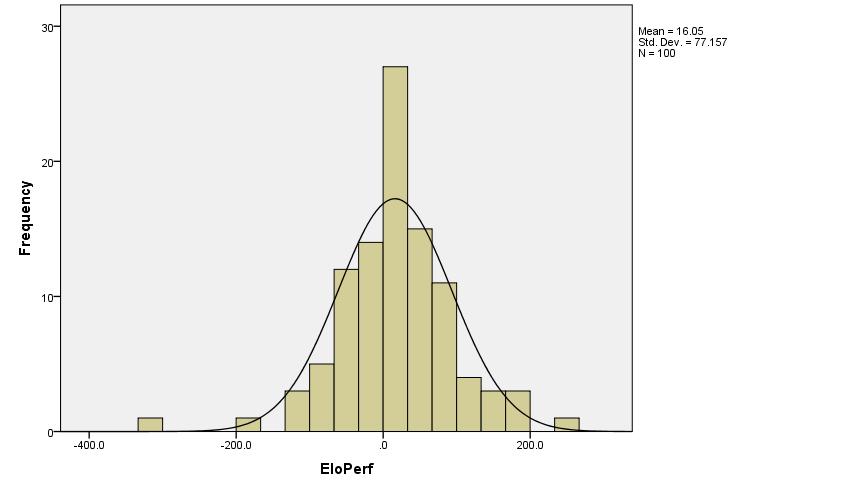
N = 100 positions
Mean Performance = 16.1 Elo points
Standard Deviation = 77.2 Elo points
But the problem is the shape is not very normal, the normal cannot accommodate both the center bulk and the tails, and one can say that the tails are too long. In these 100 positions, there were 2 hard outliers (not related to error margins), and 3-4 softer outliers.
The Std. Dev. is about 77 Elo points, and this variance comes from at least two sources: intrinsic variance of openings and variance in 100 games, which is given by about 30 Elo Points Std. Dev. So, "Intrinsic Standard Deviation" seems to be about 70 Elo points (instead of 77).
These are very rough and flimsy results, I hope you will come with something solid.